Proportional Relationships
8 lessons, about 20 days with the quiz, review and test, in one download: Unit Rates, Solving Proportions, Proportional Relationships in Tables, Proportional Relationships in Graphs, Constant of Proportionality, Writing Equations y = kx, Interpreting Points on Proportional Graphs, Proportional vs. Nonproportional.
8 lessons, in teaching order
Built to 7.RP.A.1, 7.RP.A.2, 7.RP.A.2a, 7.RP.A.2c, 7.RP.A.2d. Each lesson has guided notes, practice, an exit ticket, a homework page, worked answer keys and a click-by-click Teacher Deck.
- Lesson 1 Unit Rates I can find unit rates when one or both quantities are fractions: write the rate as a complex fraction, divide, and use the unit rate to compare and to find totals.
- Lesson 2 Solving Proportions I can set up a proportion with the quantities in the same order, solve it with a scale factor, a unit rate or cross products, and test whether two ratios form a proportion.
- Lesson 3 Proportional Relationships in Tables I can decide whether a table shows a proportional relationship: divide y by x in every column, check that an x = 0 column reads y = 0, ignore the steps in y, and use the one quotient to fill in a proportional table.
- Lesson 4 Proportional Relationships in Graphs I can decide whether a graph shows a proportional relationship with two checks: the shape check (one straight line, or dots on one) and the start check (the line goes through (0, 0), extended if it has to be).
- Lesson 5 Constant of Proportionality I can decide whether a relationship is proportional, find the constant of proportionality k in a table, a graph, an equation or a description, write y = kx, and explain what the point (1, k) means.
- Lesson 6 Writing Equations y = kx I can write the equation of a proportional relationship from a table, a graph or a story: name the letters, put the quantity that depends alone on the left, find k by dividing it by the other quantity, and check a second pair.
- Lesson 7 Interpreting Points on Proportional Graphs I can explain what a point (x, y) on the graph of a proportional relationship means in its story, with x read first and both units named, explain why (0, 0) is on the graph, and use points to answer questions.
- Lesson 8 Proportional vs. Nonproportional I can decide whether a story, a table, a graph or an equation shows a proportional relationship by asking one question in every form: is y always the same number times x, with no added number?
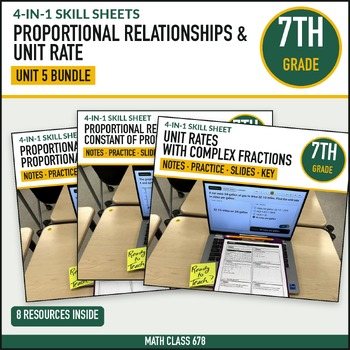
Everything for Unit 5
- Student packets, color and InkSaver, with all 8 lessons in teaching order: notes, practice, apply, an exit ticket and a homework page for each
- Answer keys: every problem worked step by step, the common mistakes, and a key for every homework page
- Teacher Decks: an interactive PowerPoint deck with speaker notes for each lesson, plus a completed deck PDF
- Assessments: a quiz, a unit review and Unit Test Forms A and B, each with a fully worked answer key, in color, InkSaver and editable Word
- A unit overview: the lessons in teaching order and the days for each
Or the whole year: the 7th Grade Math Curriculum bundle, all 9 units for $167.99
The standards in this unit
How to explain each one, worked examples and the mistakes students make.
The rest of 7th grade
Standard codes refer to the Common Core State Standards for Mathematics. Math Class 678 is an independent publisher, not affiliated with, sponsored by, or endorsed by NGA Center or CCSSO. Every product is sold on Teachers Pay Teachers.