Mean, Median, Mode & Box Plots
9 lessons, about 20 days with the quiz, review and test, in one download: Statistical Questions, Understanding Distributions, Mean as Fair Share, Median, Mode and Range, Center vs Variability, Mean Absolute Deviation, Dot Plots, Histograms & Box Plots, Box Plots, Numerical Data Summaries.
9 lessons, in teaching order
Built to 6.SP.A.1, 6.SP.A.2, 6.SP.A.3, 6.SP.B.5c, 6.SP.B.4, 6.SP.B.5. Each lesson has guided notes, practice, an exit ticket, a homework page, worked answer keys and a click-by-click Teacher Deck.
- Lesson 1 Statistical Questions I can recognize a statistical question as one that expects answers that vary, and explain the variability in its data.
- Lesson 2 Understanding Distributions I can describe the distribution of a data set by its center (the median), its spread (the range) and its overall shape.
- Lesson 3 Mean as Fair Share I can understand the mean as a fair share: pool every value into one total and share it equally among all of the values, even out stacks so the extra above the mean fills the gaps below it, and find how much must move to make the shares equal.
- Lesson 4 Median, Mode and Range I can find the median, the mode and the range of a data set given in a frequency table: add the counts to find n, count through them to the middle position, take the value with the greatest count as the mode, and subtract the least value from the greatest.
- Lesson 5 Center vs Variability I can recognize that a measure of center sums up a data set with one typical value, while a measure of variation tells with one number how much the values vary.
- Lesson 6 Mean Absolute Deviation I can find the mean absolute deviation as the typical distance from the mean, counting every value (a value at the mean has a distance of 0), and explain the MAD in words: a typical value is about that far from the mean.
- Lesson 7 Dot Plots, Histograms & Box Plots I can display numerical data in a dot plot, a histogram or a box plot, find the five numbers behind a box plot, and read what each display shows.
- Lesson 8 Box Plots I can read and draw box plots: read the five-number summary, and use the four parts (each about a quarter of the values, however wide) to find about how many values or what fraction of them lie in a range.
- Lesson 9 Numerical Data Summaries I can summarize a numerical data set with its number of observations, the attribute and its unit, a center and a spread, find the mean absolute deviation, and choose the measures that fit the data's shape.
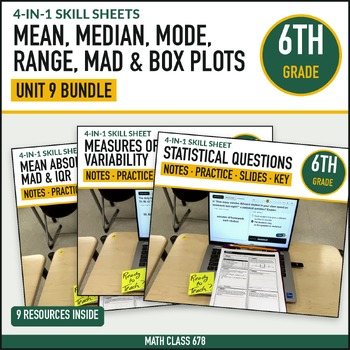
Everything for Unit 9
- Student packets, color and InkSaver, with all 9 lessons in teaching order: notes, practice, apply, an exit ticket and a homework page for each
- Answer keys: every problem worked step by step, the common mistakes, and a key for every homework page
- Teacher Decks: an interactive PowerPoint deck with speaker notes for each lesson, plus a completed deck PDF
- Assessments: a quiz, a unit review and Unit Test Forms A and B, each with a fully worked answer key, in color, InkSaver and editable Word
- A unit overview: the lessons in teaching order and the days for each
Or the whole year: the 6th Grade Math Curriculum bundle, all 9 units for $179.99
The standards in this unit
How to explain each one, worked examples and the mistakes students make.
The rest of 6th grade
Standard codes refer to the Common Core State Standards for Mathematics. Math Class 678 is an independent publisher, not affiliated with, sponsored by, or endorsed by NGA Center or CCSSO. Every product is sold on Teachers Pay Teachers.