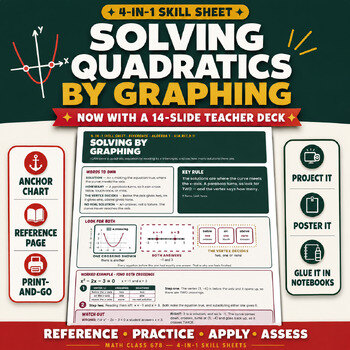
Solving Quadratics by Graphing
I can solve a quadratic equation by reading its x-intercepts, and say how many solutions there are.
The problem this sheet solves
Solving graphically means reading where the curve meets y = 0, and the vertex is the most visually obvious point on a parabola while usually not being a solution at all. Students also read a curve that misses the axis as a mistake rather than as an answer, when no real solution is the finding. Every graph on this sheet is generated from its own equation and checked against it, so the crossings on the page are the crossings the algebra gives. The sheet separates what the vertex tells you — how many solutions there are — from what the intercepts tell you, which is what they are, and treats no real solution as a complete answer that needs a reason rather than a surrender.
The key rule
The solutions are where the curve meets the x-axis. A parabola turns, so look for TWO — and the vertex says how many.
It turns. Look twice.
Watch out
The mistake: For x2 − 2x − 3 = 0 a student answers x = 3.
The fix: 3 is a solution, and so is −1. The curve comes down, crosses, turns at (1, −4) and goes back up, so it crosses TWICE.
What is included
- Reference page — student-friendly definitions, a worked example, a Watch Out error pair, and the key rule
- Practice page — six problems, building from foundational to multi-step
- Apply page — a word problem, a reasoning prompt, and an error-analysis task
- Assess — a half-page exit ticket, two to a sheet, with a score box
- Full answer key — every item worked, plus a grading guide that says what each wrong answer tells you
- Ink-saver edition of all 7 pages
- 14-slide teacher deck (PowerPoint) with presenter notes on every slide
Standard codes refer to the Common Core State Standards for Mathematics. Math Class 678 is an independent publisher, not affiliated with, sponsored by, or endorsed by NGA Center or CCSSO. Every product is sold on Teachers Pay Teachers.