Data Displays: Dot/Histogram/Box Plots
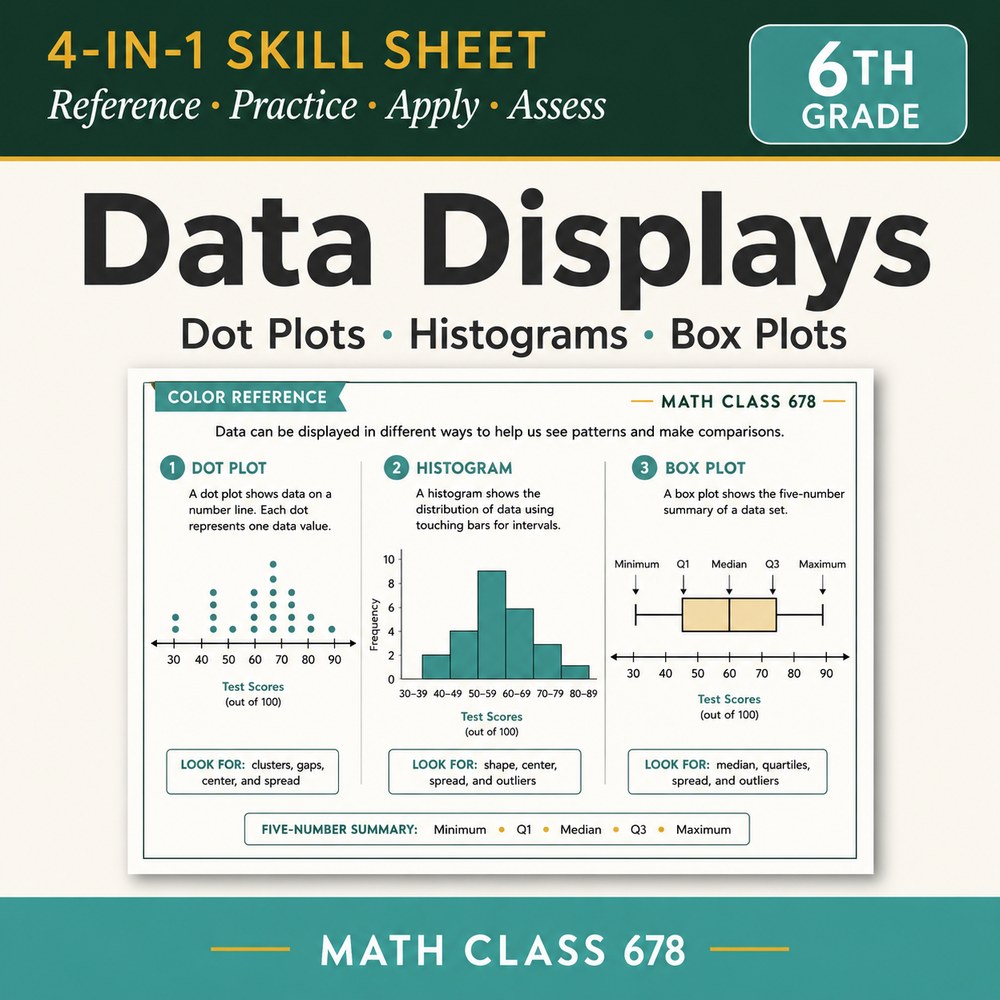
Students learn to display numerical data in dot plots, histograms, and box plots.
About this skill sheet
Data Displays covers dot plots, histograms, and box plots for 6th grade, teaching students to display numerical data in each form. Aligned to CCSS 6.SP.B.4, the sheet pairs a reference page comparing the three displays with guided practice, applied problems, and a built-in exit ticket with an answer key.
What is inside
Every 4-in-1 Skill Sheet moves a student through four phases on a single printable: a color Reference page with definitions, a worked example and a Watch Out error pair; six sequenced Practice problems; Apply word problems with an error analysis; and an Assess exit ticket, with a full two-page answer key and an ink-saver edition. A 14-slide teacher deck is included, with the teaching script in the speaker notes.
Save with a bundle
This skill sheet is included in these bundles. Buy the bundle to get this skill plus related ones in one download.
Get a free 4-in-1 Skill Sheet
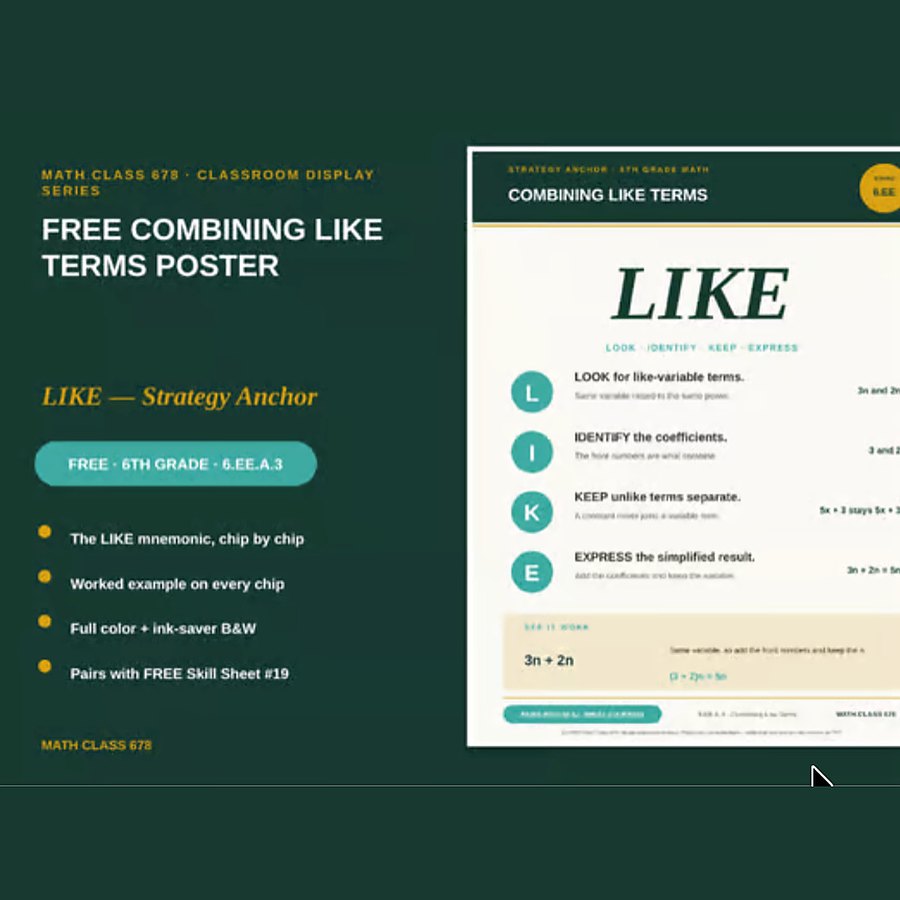
Want to see the format in your own hands first? Enter your email and I’ll send you the Combining Like Terms 4-in-1 Skill Sheet for 6th grade — a complete lesson on one printable, free.
- A complete lesson on one printable, not a watered-down sample
- Reference, practice, real-world application, and an exit ticket with answer key
- A 14-slide teacher deck with the teaching script in the speaker notes
No spam. Unsubscribe in one click anytime.