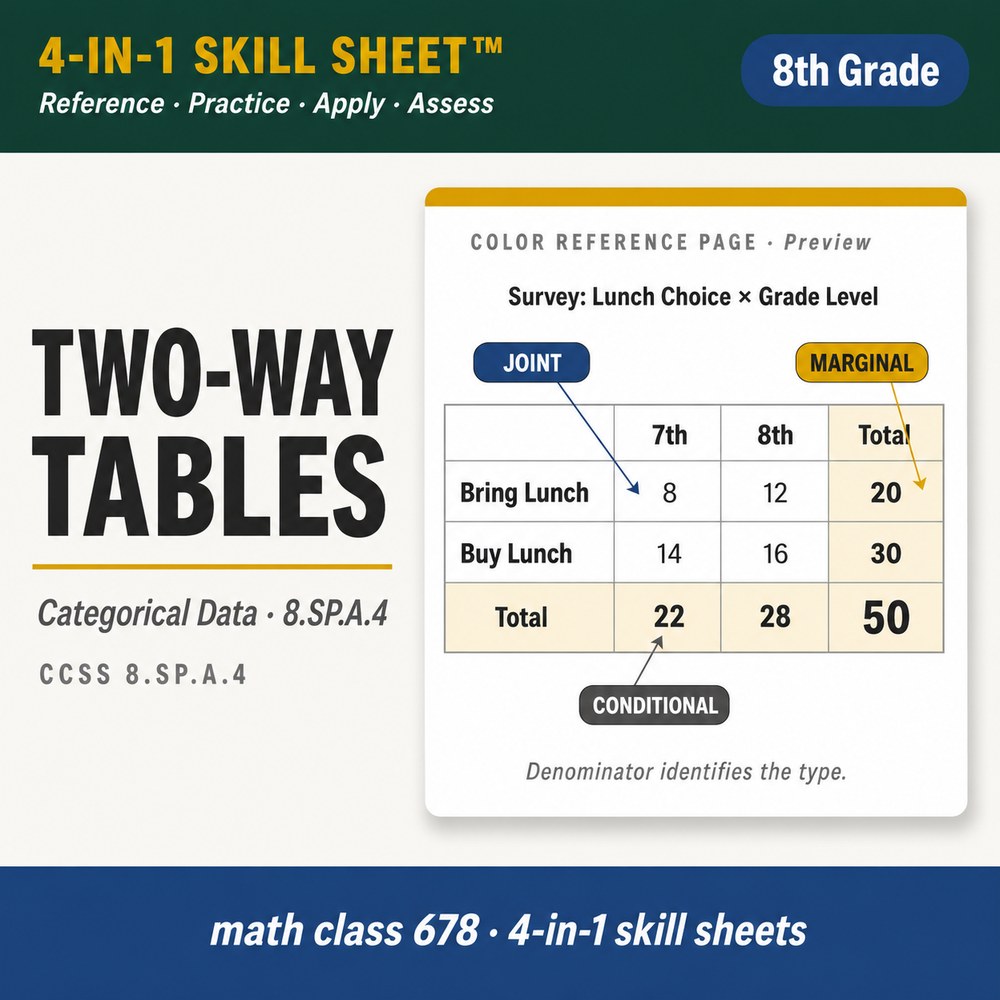
8.SP.A.4
Two-Way Tables
Students learn to construct and interpret two-way tables to find patterns in categorical data.
8th Grade
View sheet
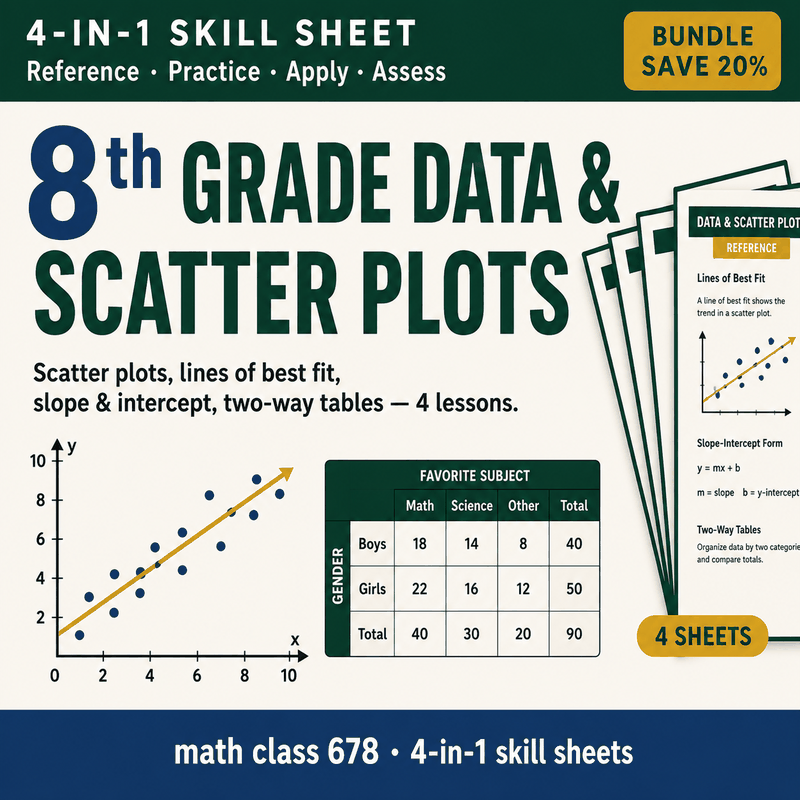
The full 8.SP strand: scatter plots, lines of best fit, interpreting slope and intercept, and two-way tables. Four 4-in-1 Skill Sheets that teach students to model and interpret bivariate data, each with a reference page, scaffolded practice, real-world application, and a built-in exit ticket.
4 complete 4-in-1 Skill Sheets. Each one is a single printable that takes students through a color Reference page, scaffolded Practice, real-world Apply problems, and an Assess exit ticket with a full answer key. Select any skill below to see its standard and details.
Students learn to construct and interpret two-way tables to find patterns in categorical data.
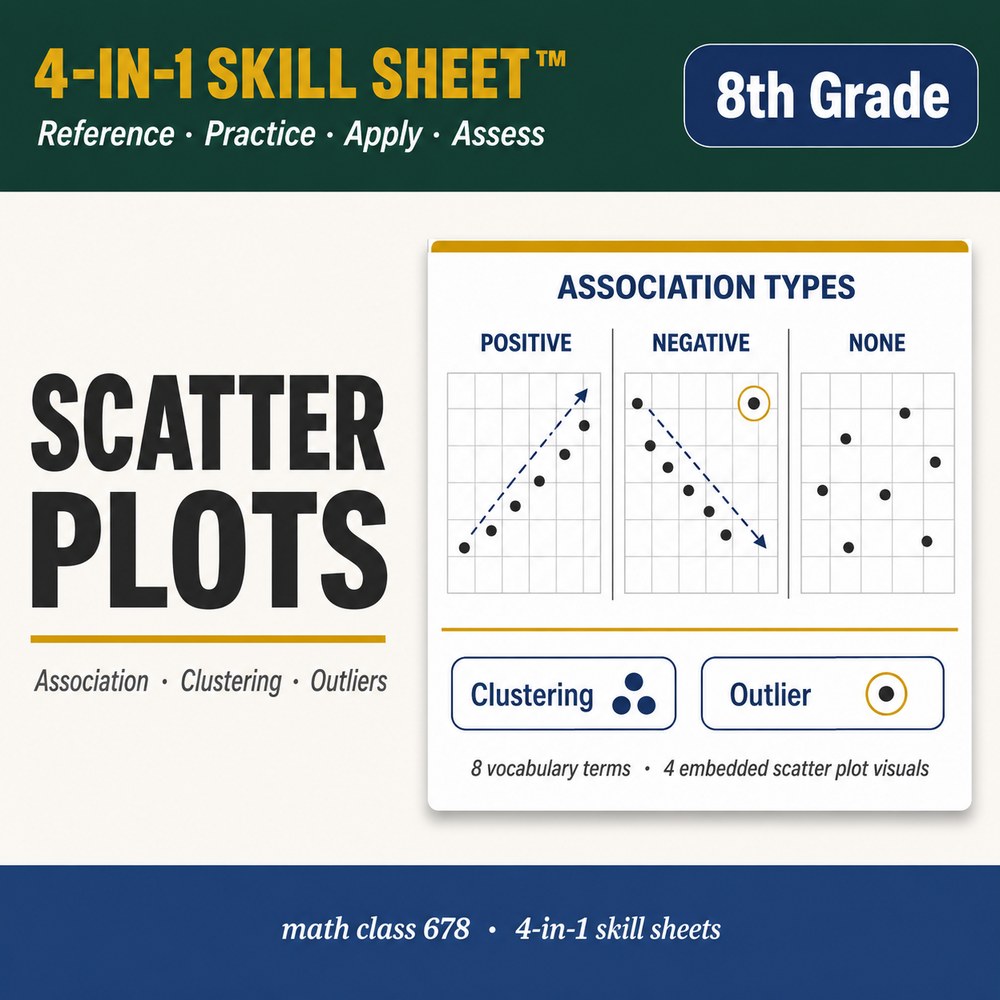
Students learn to construct and interpret scatter plots and describe patterns of association.
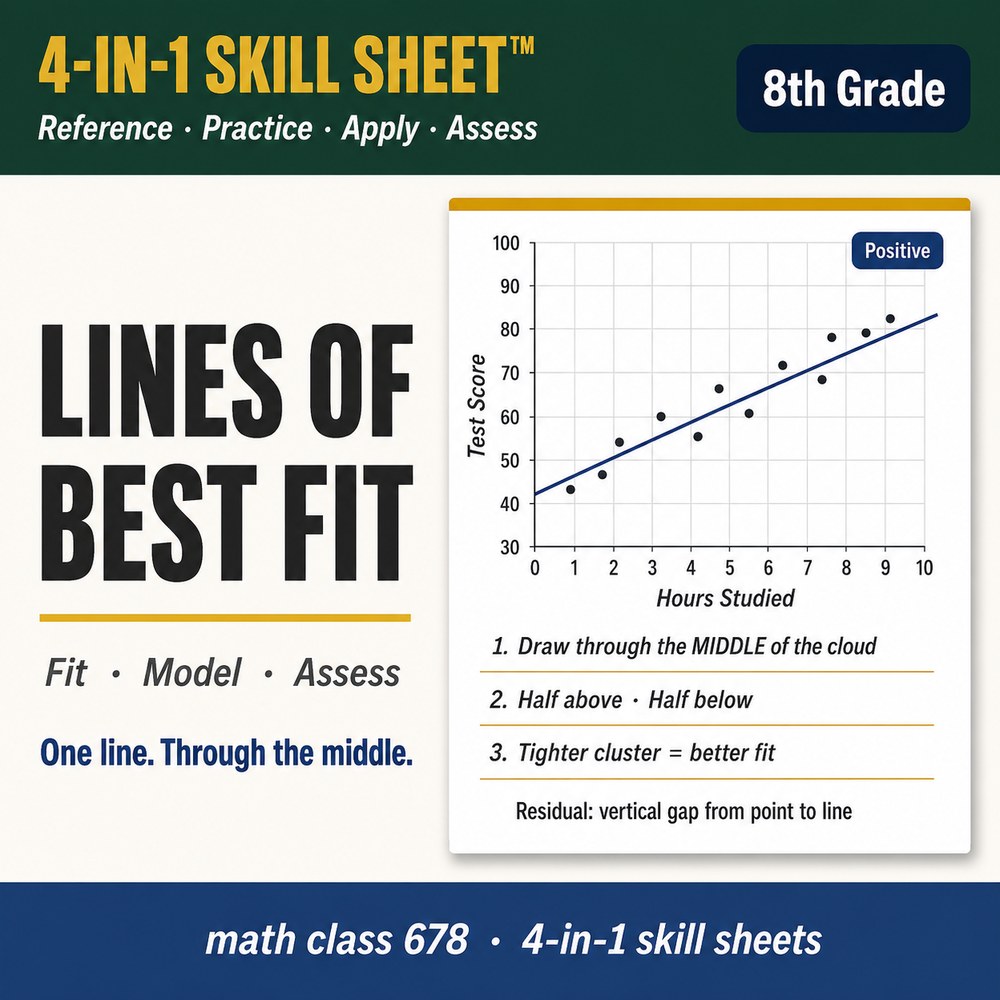
Students learn to fit a line to data and use its slope and intercept to make predictions.
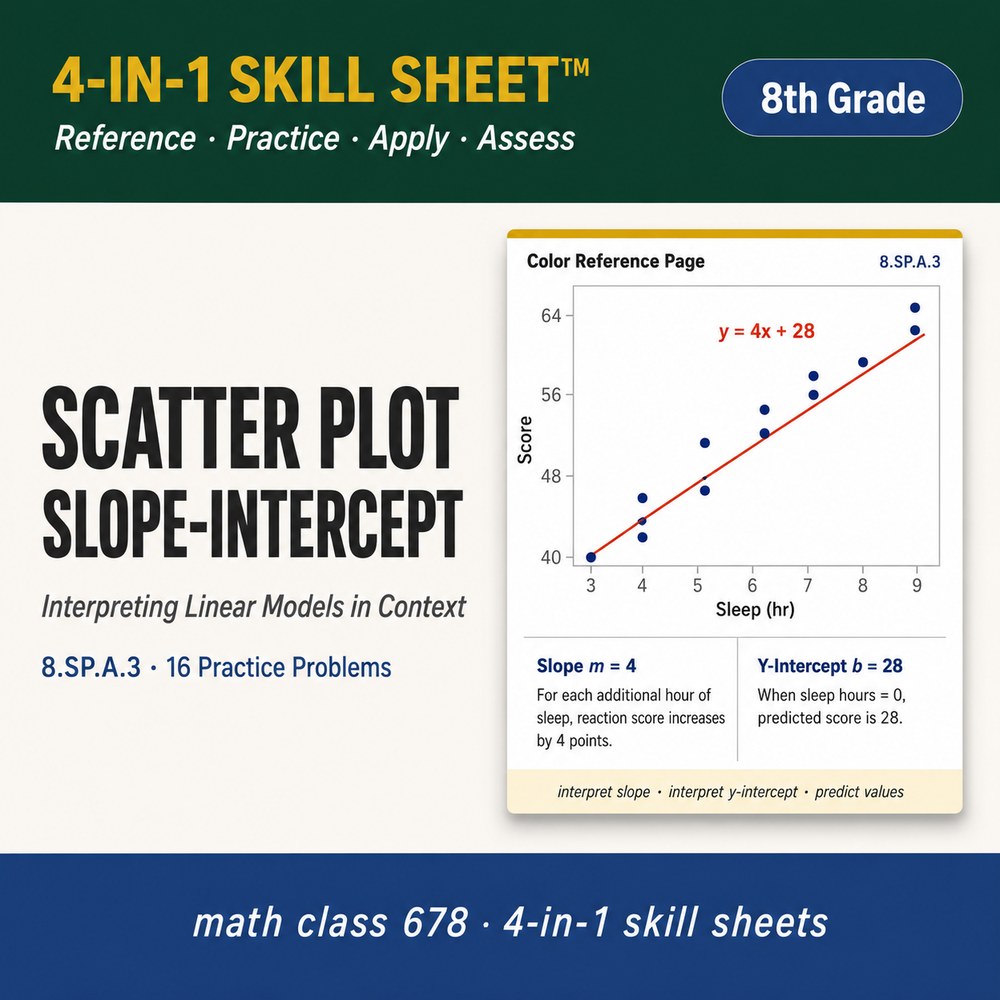
Students learn to interpret the slope and intercept of a line that models scatter-plot data.
Sign up and I'll send you Combining Like Terms for 6th grade — a complete 4-in-1 Skill Sheet, no strings attached. You'll also hear when new sheets publish and when the store runs a sale.