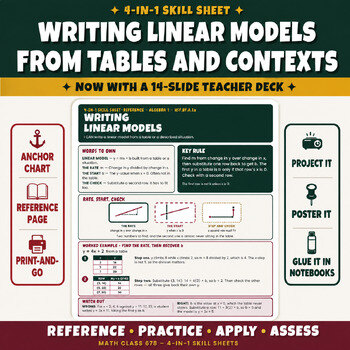
Writing Linear Models from Tables and Contexts
I can write a linear model from a table or a described situation.
The problem this sheet solves
b is the value at x = 0, and a table that does not start at zero never shows it. Students who read the first row as the intercept produce a model with the correct slope, which means it fails at every point by the same amount and still looks plausible. Nothing in the table warns them. This sheet finds the rate first, then SUBSTITUTES a row back to recover b, which is the step that makes the starting x-value irrelevant. Every model is tested against a second row, since one row cannot distinguish a right model from this particular wrong one, and tables deliberately start away from zero.
The key rule
Find m from change in y over change in x, then substitute one row back to get b. The first y in a table is b only if that row's x is 0. Check with a second row.
The first row is not b unless x is 0.
Watch out
The mistake: For x = 2, 4, 6 against y = 11, 17, 23, a student writes y = 3x + 11, taking the first y as b.
The fix: b is the value at x = 0, which the table never shows. Substitute a row: 11 = 3(2) + b, so b = 5 and the model is y = 3x + 5.
What is included
- Reference page — student-friendly definitions, a worked example, a Watch Out error pair, and the key rule
- Practice page — six problems, building from foundational to multi-step
- Apply page — a word problem, a reasoning prompt, and an error-analysis task
- Assess — a half-page exit ticket, two to a sheet, with a score box
- Full answer key — every item worked, plus a grading guide that says what each wrong answer tells you
- Ink-saver edition of all 7 pages
- 14-slide teacher deck (PowerPoint) with presenter notes on every slide
Standard codes refer to the Common Core State Standards for Mathematics. Math Class 678 is an independent publisher, not affiliated with, sponsored by, or endorsed by NGA Center or CCSSO. Every product is sold on Teachers Pay Teachers.