A93 · HSS.ID.A.1
Dot Plots, Histograms, and Box Plots
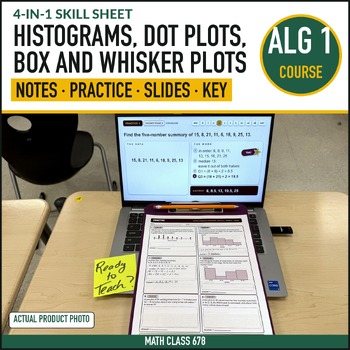
I can read a dot plot, a histogram and a box plot, and count the values in each part.
See the lesson7 lessons, one skill each: Dot Plots, Histograms, and Box Plots, Measures of Center and Spread, Comparing Distributions and Outliers, Two-Way Frequency Tables, Scatter Plots and Lines of Best Fit, Residuals and Goodness of Fit, Correlation Coefficient and Causation.
Built to HSS.ID.A.1, HSS.ID.A.2, HSS.ID.A.3, HSS.ID.B.5, HSS.ID.B.6a, HSS.ID.B.6b, HSS.ID.C.8, HSS.ID.C.9.
I can read a dot plot, a histogram and a box plot, and count the values in each part.
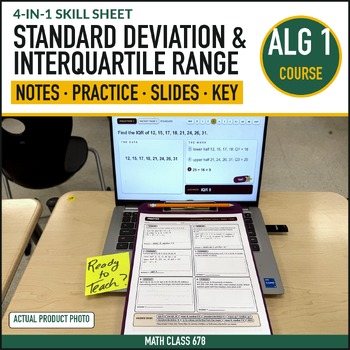
See the lessonI can find the mean, median, IQR and standard deviation, and say which pair describes the data.
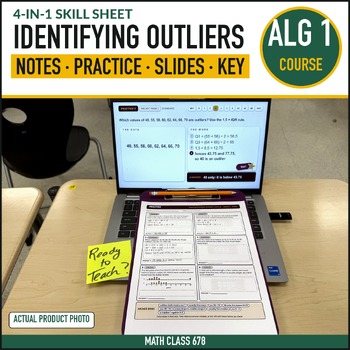
See the lessonI can test for outliers with the 1.5 × IQR rule and compare two data sets by center and spread.
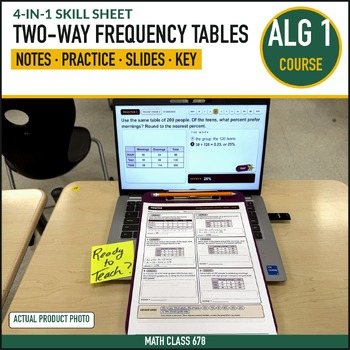
See the lessonI can find joint, marginal and conditional relative frequencies from a two-way table.
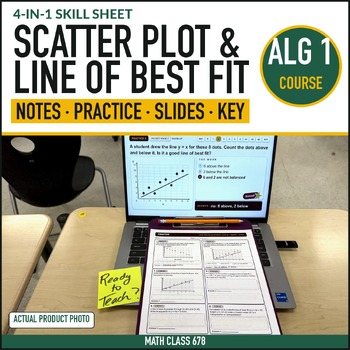
See the lessonI can judge a line of best fit, write its equation from two points on it, and predict with it.
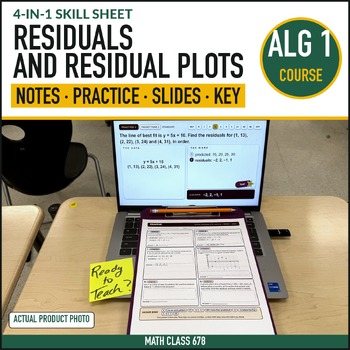
See the lessonI can find residuals and read a residual plot to judge whether a line fits.
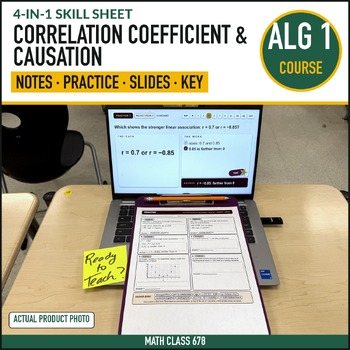
See the lessonI can describe a correlation coefficient and explain why correlation does not show causation.
See the lessonAll 7 Statistics and Data Analysis lessons: 7 interactive Teacher Decks (224 slides in all) and 7 student packets with homework and fully worked answer keys, in color and ink-saver editions. Its bonus file is the whole unit in one download, with the mid-unit quiz, unit review and Unit Test Forms A and B in color, InkSaver and editable Word.
Bought one at a time, the 7 paid lessons cost $42.00; the bundle is $20.99, a saving of $21.01 (50% off).
View the unit bundleOr the whole course: the curriculum bundle, all 99 lessons for $249.99
Standard codes refer to the Common Core State Standards for Mathematics. Math Class 678 is an independent publisher, not affiliated with, sponsored by, or endorsed by NGA Center or CCSSO. Every product is sold on Teachers Pay Teachers.