A93 · HSS.ID.A.1
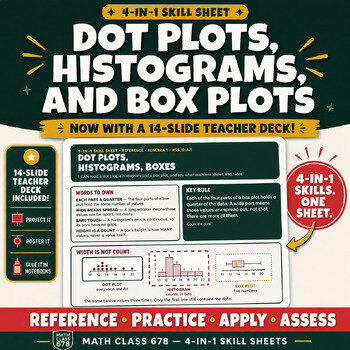
Dot Plots, Histograms, and Box Plots
I can read a dot plot, a histogram and a box plot, and say what each one shows and hides.
See the sheet7 skill sheets, one skill each: Dot Plots, Histograms, and Box Plots, Measures of Center and Spread, Comparing Distributions and Outliers, Two-Way Frequency Tables, Scatter Plots and Lines of Best Fit, Residuals and Goodness of Fit, Correlation Coefficient and Causation.
Built to HSS.ID.A.1, HSS.ID.A.2, HSS.ID.A.3, HSS.ID.B.5, HSS.ID.B.6a, HSS.ID.B.6b, HSS.ID.C.8+C.9.
I can read a dot plot, a histogram and a box plot, and say what each one shows and hides.
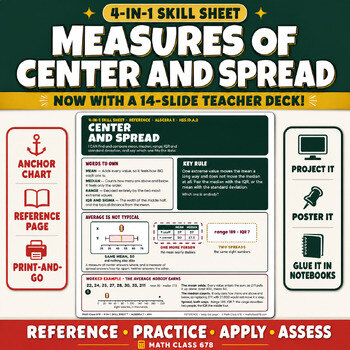
See the sheetI can find and compare mean, median, range, IQR and standard deviation, and say which one fits the data.
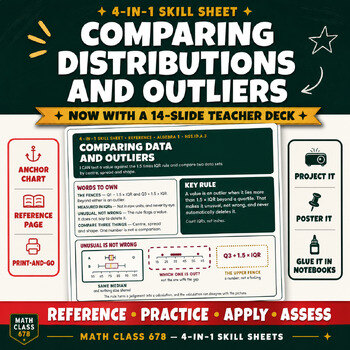
See the sheetI can test a value against the 1.5 times IQR rule and compare two data sets by centre, spread and shape.
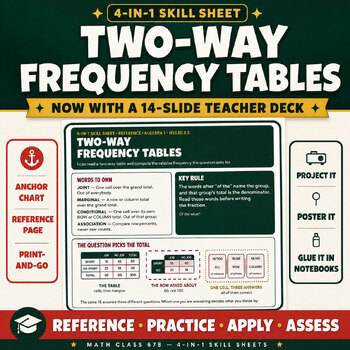
See the sheetI can read a two-way table and compute the relative frequency the question actually asks for.
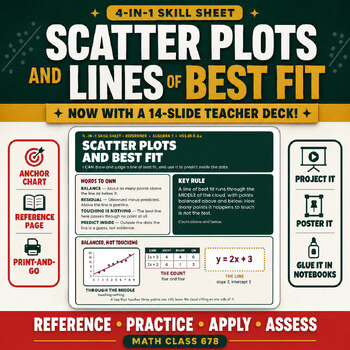
See the sheetI can draw and judge a line of best fit, and use it to predict inside the data.
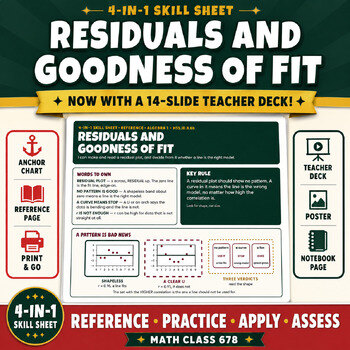
See the sheetI can make and read a residual plot, and decide from it whether a line is the right model.
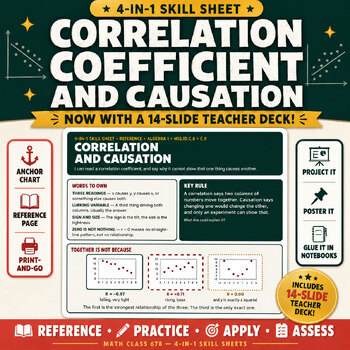
See the sheetI can read a correlation coefficient, and say why it cannot show that one thing causes another.
See the sheetAll 7 Statistics and Data Analysis skill sheets, with every answer key.
Standard codes refer to the Common Core State Standards for Mathematics. Math Class 678 is an independent publisher, not affiliated with, sponsored by, or endorsed by NGA Center or CCSSO. Every product is sold on Teachers Pay Teachers.
Sign up and I'll send you Combining Like Terms for 6th grade — a complete 4-in-1 Skill Sheet, no strings attached. You'll also hear when new sheets publish and when the store runs a sale.