Qualitative Graph Features
Students learn to sketch and describe a graph that models the relationship between two quantities.
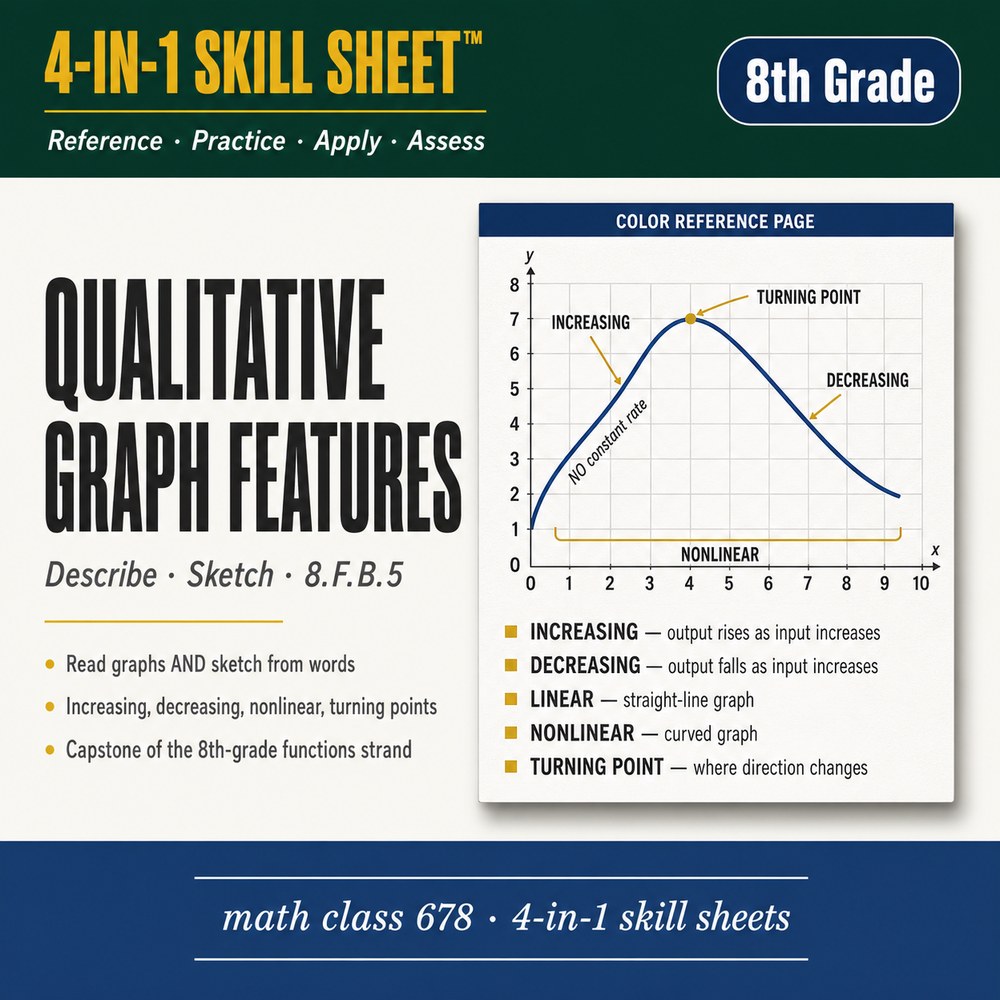
About this skill sheet
Qualitative Graph Features teaches 8th graders to sketch and describe a graph that models the relationship between two quantities, including increasing, decreasing, and constant intervals. Aligned to CCSS 8.F.B.5, the sheet runs from a reference page through guided practice and application to a short assessment, all on one printable.
What is inside
Every 4-in-1 Skill Sheet moves a student through four phases on a single printable: a color Reference page to keep, scaffolded Practice from guided notes to sixteen sequenced problems, real-world Apply problems, and an Assess exit ticket with a full answer key. A ten-slide editable teacher deck with speaker notes is included.
Save with a bundle
This skill sheet is included in these bundles. Buy the bundle to get this skill plus related ones in one download.