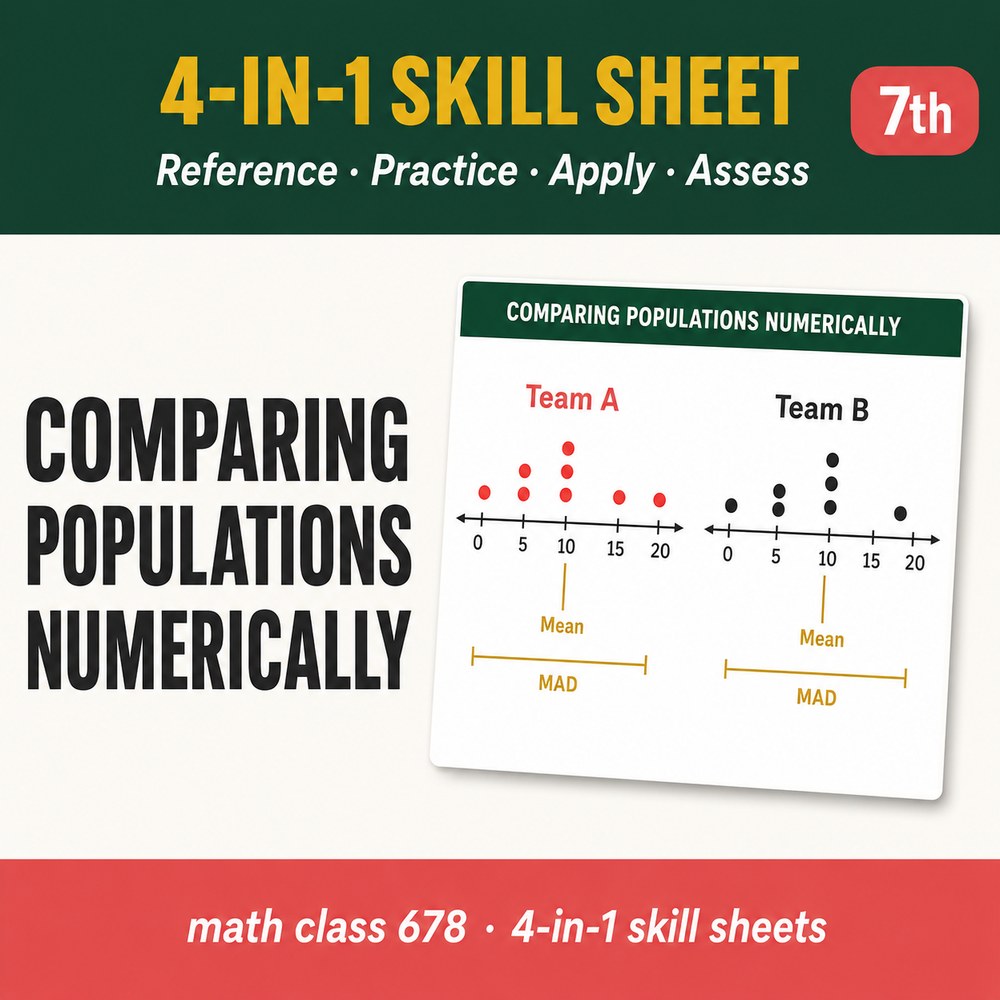
Comparing Populations Numerically
Students learn to compare two populations using measures of center and variability.
About this skill sheet
Comparing Populations Numerically teaches 7th graders to compare two populations using measures of center and variability expressed numerically. Aligned to CCSS 7.SP.B.4, this skill sheet runs from a reference page through sequenced practice and real-world application to a short assessment, giving you a full lesson on one printable.
What is inside
Every 4-in-1 Skill Sheet moves a student through four phases on a single printable: a color Reference page to keep, scaffolded Practice from guided notes to sixteen sequenced problems, real-world Apply problems, and an Assess exit ticket with a full answer key. A ten-slide editable teacher deck with speaker notes is included.
Save with a bundle
This skill sheet is included in these bundles. Buy the bundle to get this skill plus related ones in one download.