6.SP.A.1
Statistical Questions
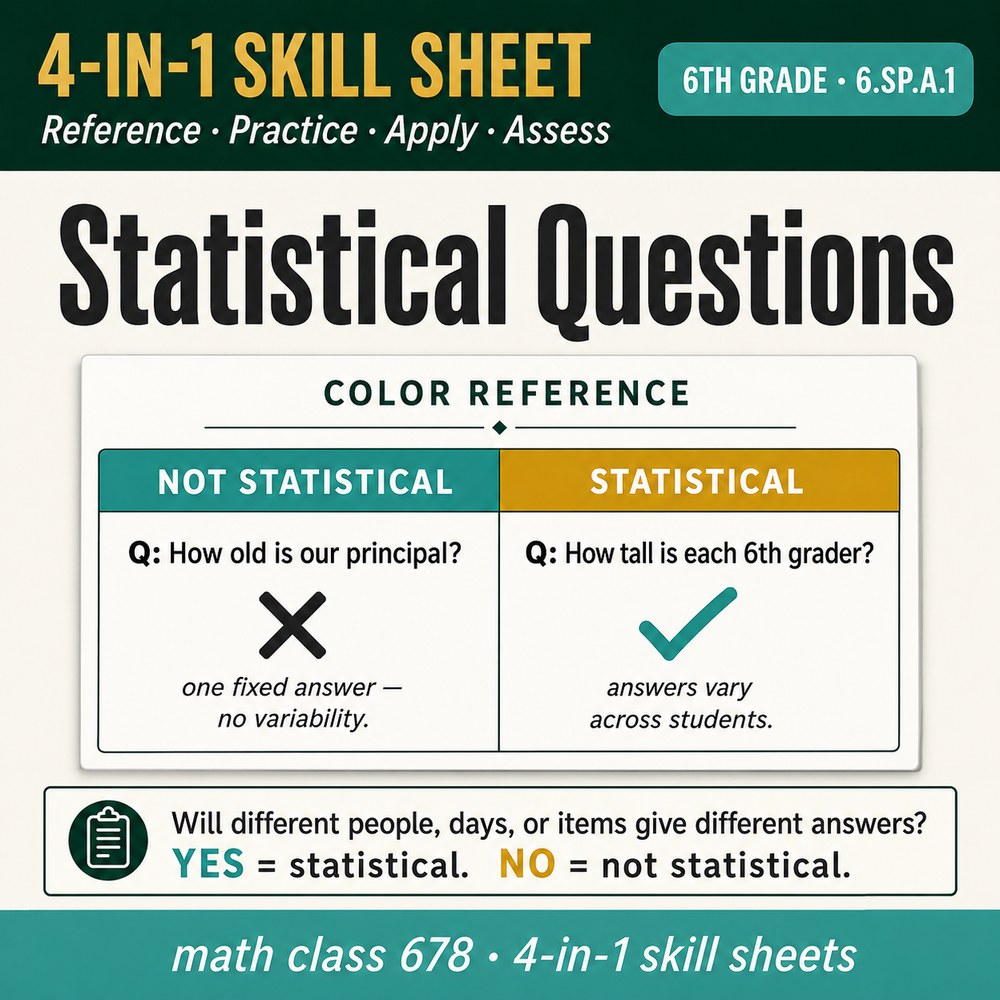
Students learn to recognize a statistical question as one that expects variety in the answers.
6th Grade
View sheet
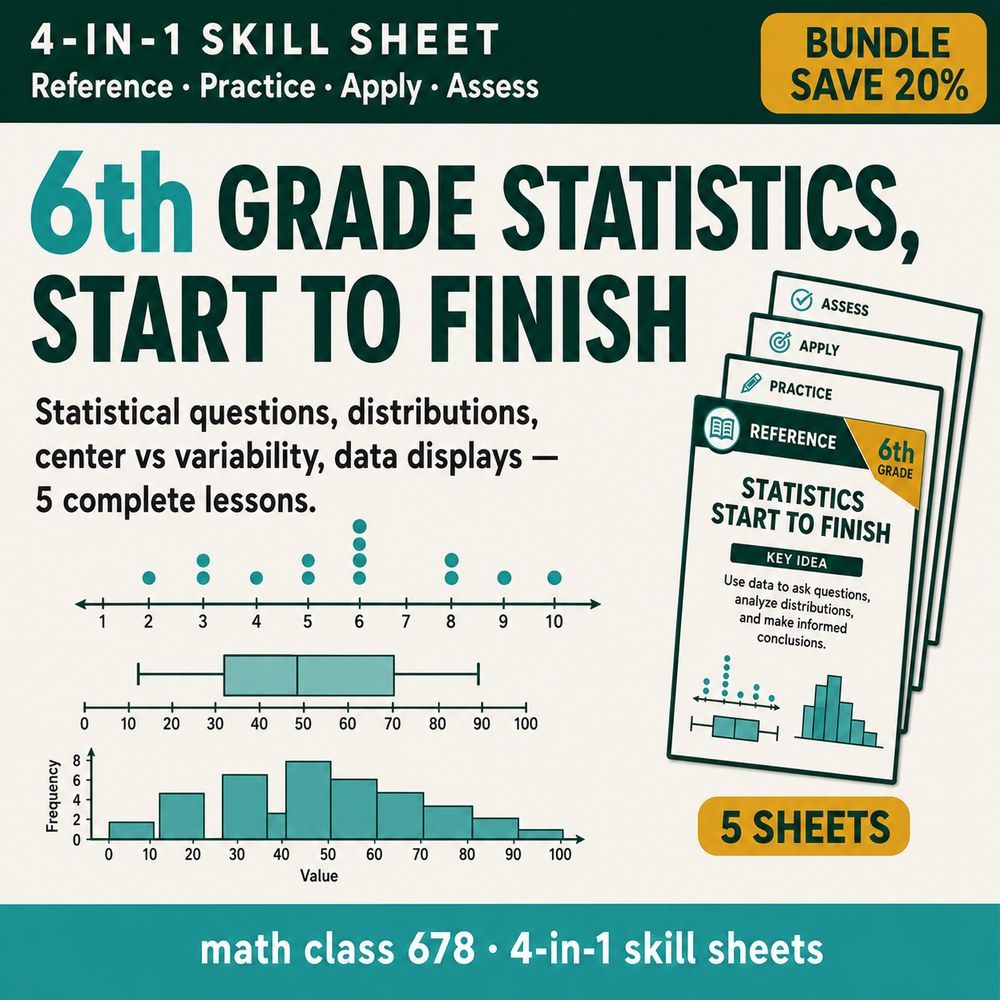
The complete 6th grade Statistics and Probability strand, aligned to 6.SP. Students learn statistical questions, distributions, center versus variability, data displays, and numerical summaries across five 4-in-1 Skill Sheets, each with a reference page, practice, real-world application, and a built-in exit ticket.
5 complete 4-in-1 Skill Sheets. Each one is a single printable that takes students through a color Reference page, scaffolded Practice, real-world Apply problems, and an Assess exit ticket with a full answer key. Select any skill below to see its standard and details.
Students learn to recognize a statistical question as one that expects variety in the answers.
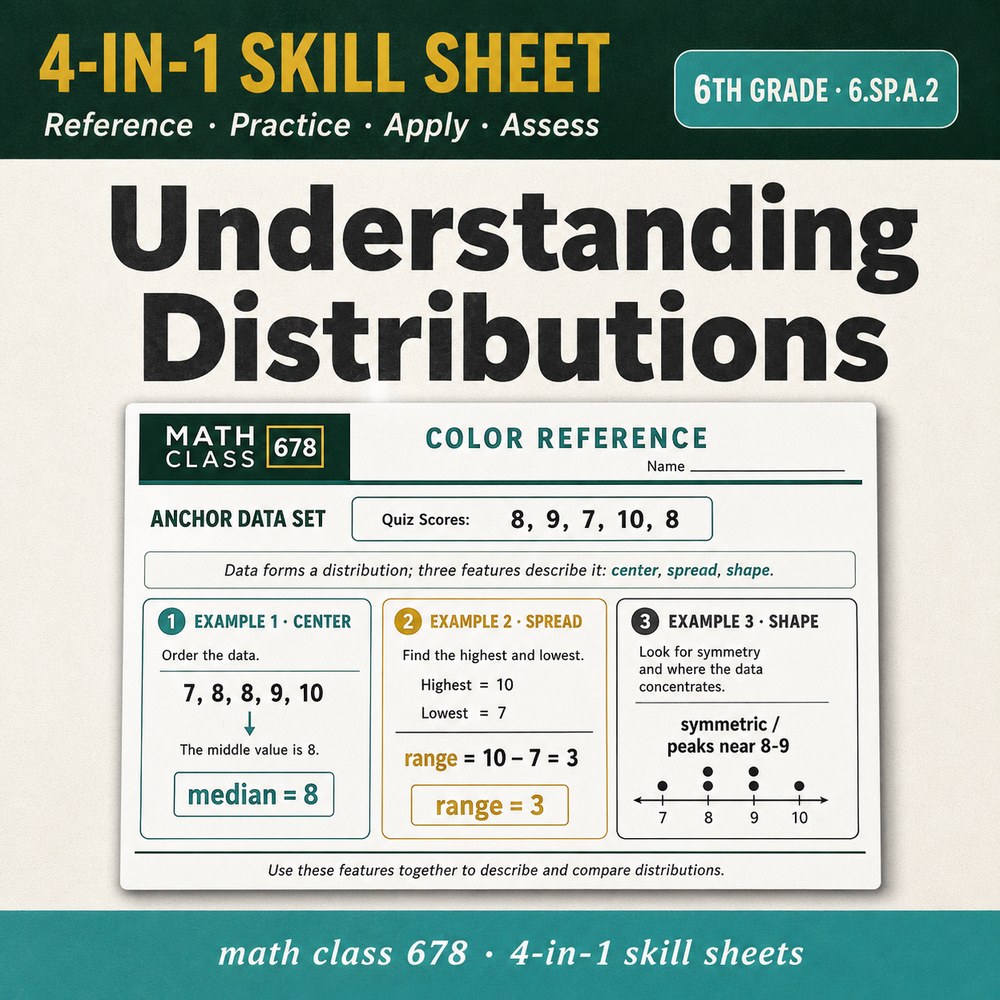
Students learn to describe a data distribution by its center, spread, and overall shape.
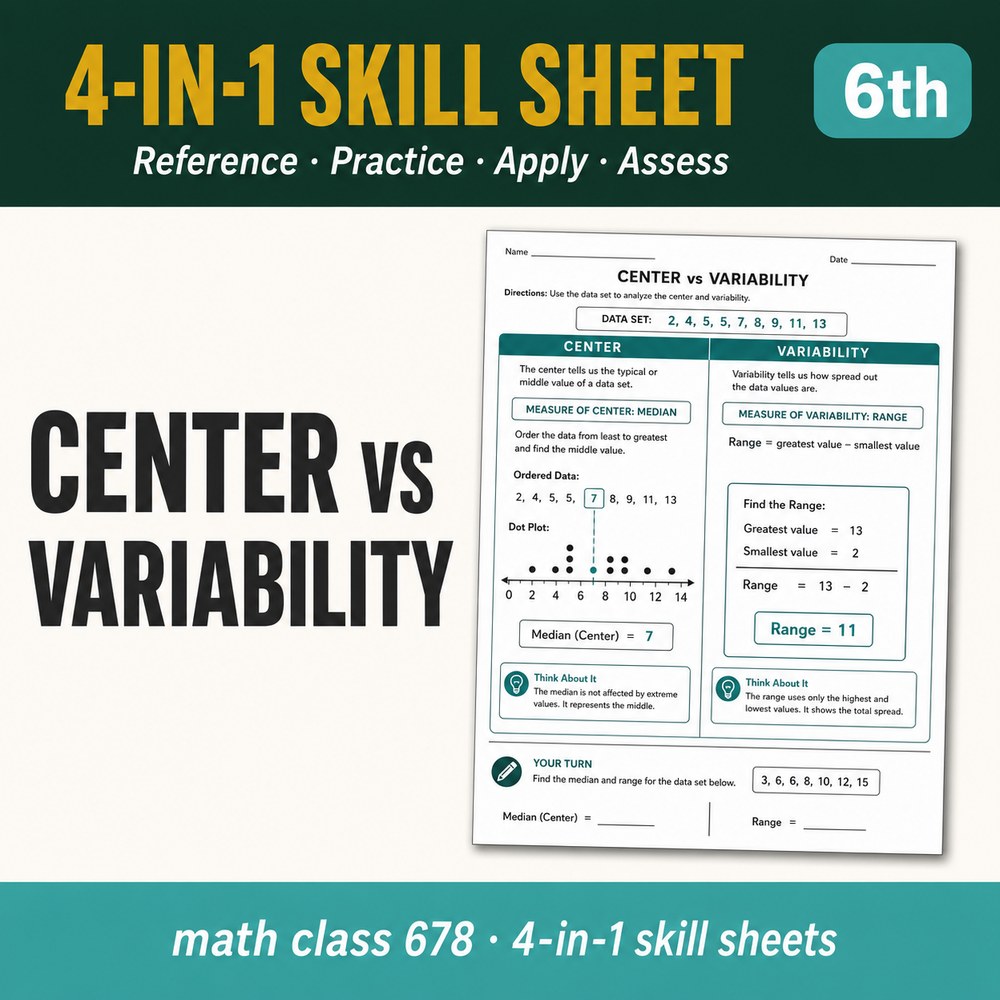
Students learn to explain how a measure of center and a measure of variation describe a data set.
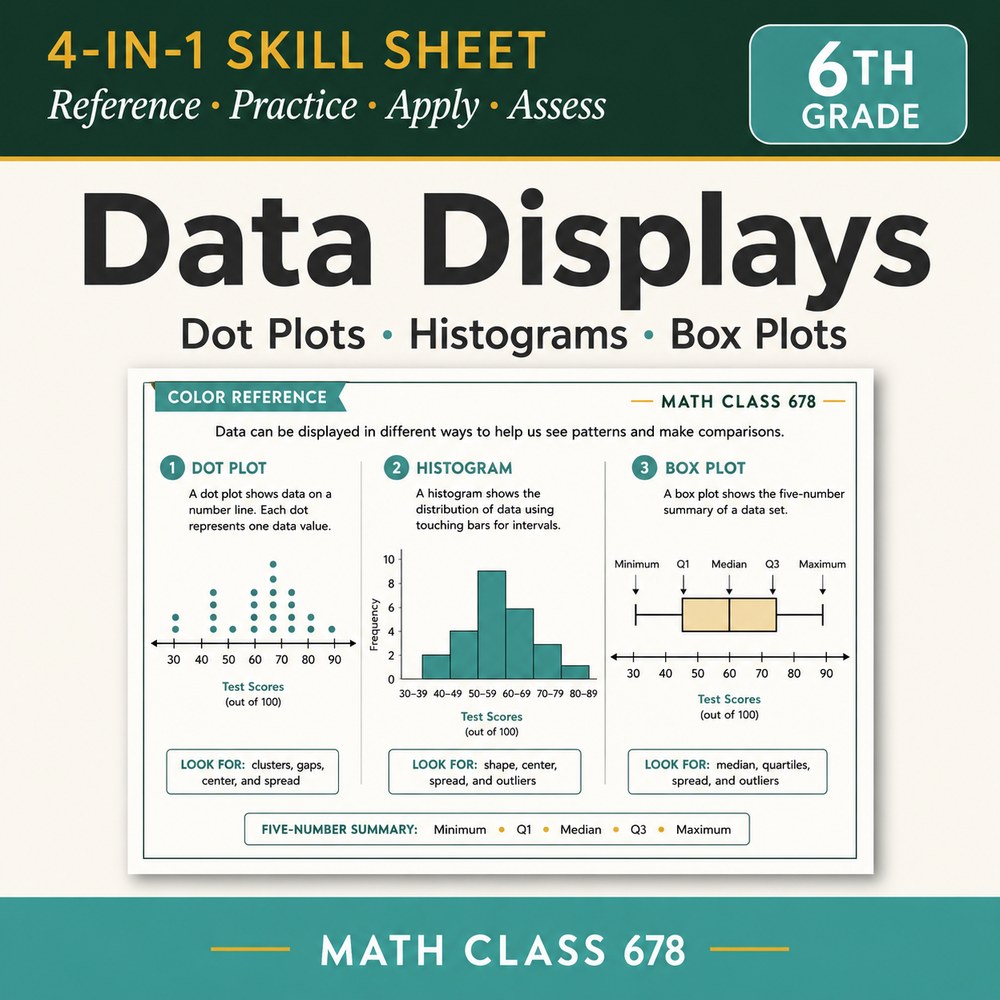
Students learn to display numerical data in dot plots, histograms, and box plots.
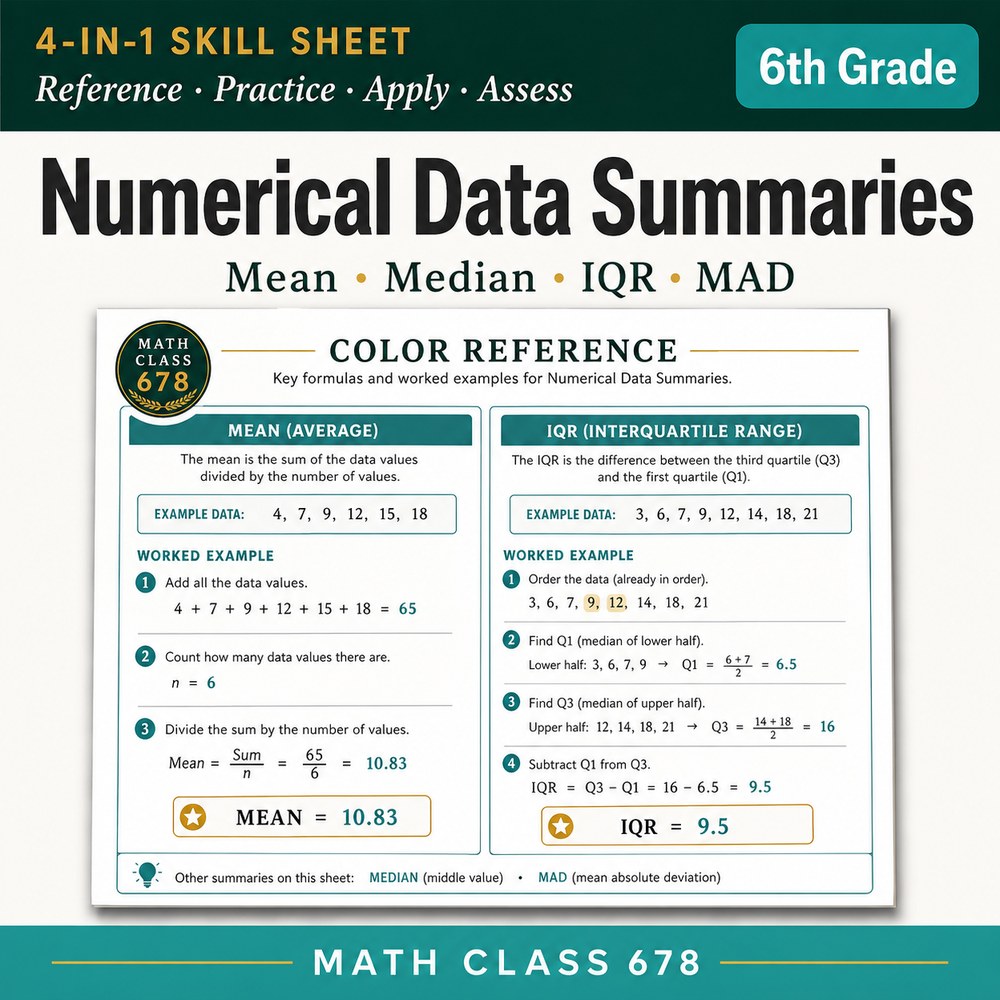
Students learn to find the mean, median, and mode of a data set and choose the best measure.
Join the list. I'll send a note when new 4-in-1 Skill Sheets drop and when the TPT store runs a sale.